
| In August 2026 the European Central Bank published its third survey on the use of cash by companies in the euro area, based on 8,205 interviews across 21 countries. Three months earlier, the Federal Reserve released its 2026 Diary of Consumer Payment Choice, the latest wave of an annual consumer study running since 2016. Read together, the two publications offer an unusually rich comparison of how cash is faring in the world’s two largest currency areas — and the picture they paint is more subtle than the familiar narrative of parallel decline. This note examines both datasets, identifies what can and cannot be compared, and draws out the structural differences between the American and European cash equilibria. |
Key findings at a glance
Cash acceptance by euro area companies has stopped declining. In 2026, 92% of companies with physical points of sale accept cash, up from 90% in 2024. The ECB’s own conclusion is that the post-pandemic decline in acceptance “has paused”. Of the companies that accept cash today, 92% intend to continue doing so over the next five years.
Cash use by US consumers has been stable for three consecutive years. Americans make an average of six cash payments per month out of 47 total — making cash the third most used instrument for the sixth year in a row, behind credit (16) and debit (15) cards. Four out of five US consumers used cash in the past 30 days, and 90% plan to continue using it.
The two systems have settled into different equilibria. The euro area combines high merchant acceptance (92%) with a consumer cash share at the point of sale that remains among the highest in advanced economies. The United States combines a lower transactional cash share with remarkable stability and a strong role for cash as a store of value: 76% of American adults carry cash (averaging $69), and 45% keep an average of $364 stored at home or elsewhere for savings or emergencies.
The vulnerability question is real but more specific than it first appears. The euro area data reveal one channel of concern with precision: among companies that do not accept cash, the share citing difficulty or inconvenience of depositing and withdrawing cash rose from 22% in 2024 to 35% in 2026 — the fastest-growing reason for non-acceptance. This is an infrastructure signal, not a demand signal, and it is the point where the two continents’ trajectories genuinely diverge.
Automation is the quiet frontier. In the euro area, 13% of companies have introduced self-checkout terminals, and in nearly half of those companies (48%), none of the terminals accept cash. The ECB itself warns that perceived acceptance may fall even where formal acceptance is maintained, if paying in cash becomes practically harder. One quarter of euro area companies report having taken measures to encourage digital payments.
Appreciation is rising faster than access. Both surveys show consumers and merchants valuing cash more clearly than in previous waves — euro area companies rate it ahead of digital payments on privacy and reliability, and US consumers hold it in growing amounts as a deliberate backup. None of this reflects an improvement in the conditions for obtaining or depositing cash. If anything, the infrastructure data point the other way: the euro area’s fastest-growing reason for merchant non-acceptance is the difficulty of banking cash, not a lack of desire to use it. Recognition of cash’s value and the ease of accessing it are moving in different directions, and the second is the one policy can still act on.
1. The euro area in 2026: acceptance has stabilised
The ECB’s survey on the use of cash by companies, conducted between February and April 2026 among 8,205 enterprises in the retail trade, hospitality, and arts and entertainment sectors, is the merchant-side counterpart to the better-known SPACE consumer survey. Its third wave delivers the most important single data point of the year for the European cash debate: acceptance has stopped falling.
In 2026, 92% of companies that sell at physical locations accept cash, compared with 90% in 2024. Card acceptance stands at 88% (87% in 2024). The genuinely dramatic movement is elsewhere: mobile payment acceptance has almost doubled in two years, from 36% to 68%. The euro area merchant is not choosing between cash and digital — it is adding payment options across the board.
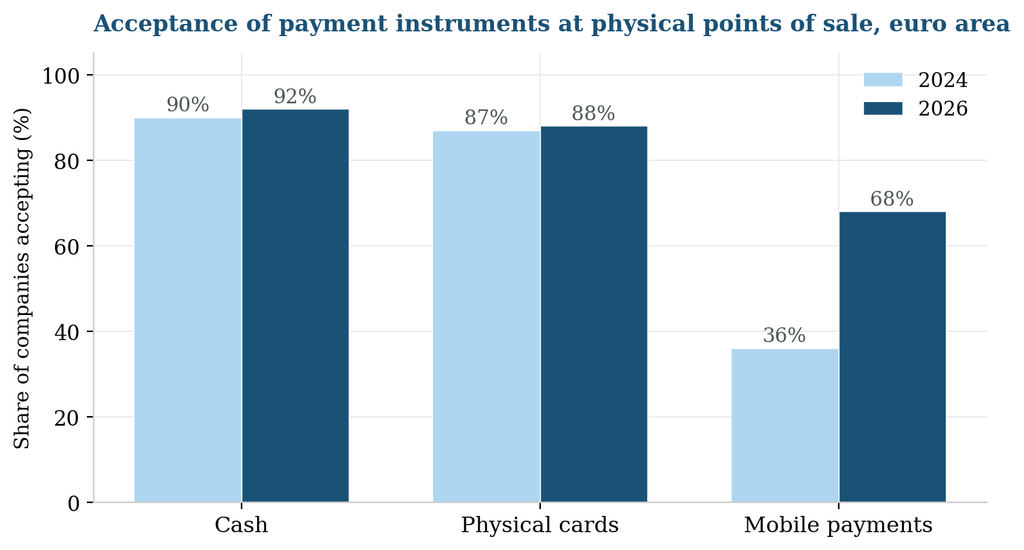
Chart 1. Source: ECB, Use of cash by companies in the euro area, 2026 (survey of 8,205 companies).
The cross-country variation remains wide. Greece and Italy record 99% cash acceptance among SMEs; at the other end, Belgium stands at 81% and Cyprus at 76%. The movements since 2024 are equally revealing: Cyprus and Slovakia gained nine percentage points each, while Belgium lost ten and Ireland nine. Acceptance is not drifting uniformly downward — it is diverging across countries, responding to national conditions, infrastructure and policy.
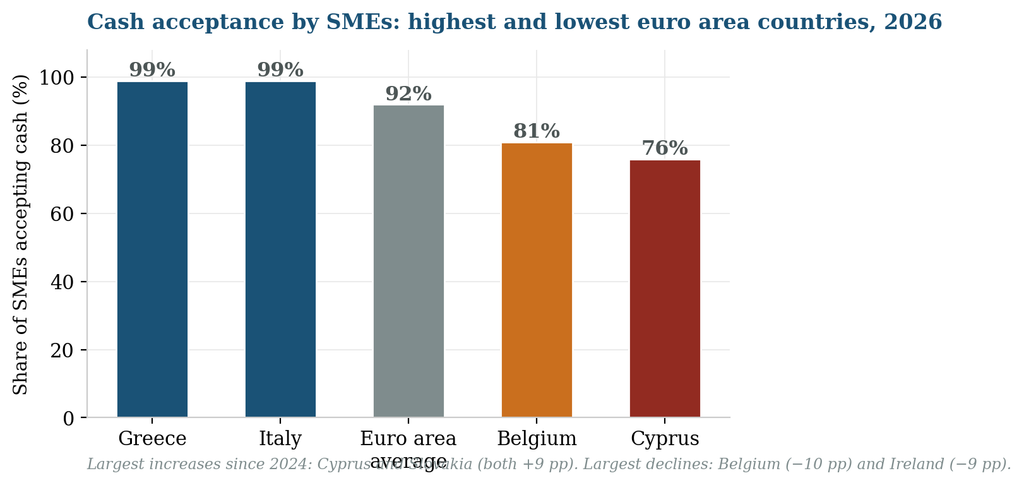
Chart 2. Source: ECB, Use of cash by companies in the euro area, 2026. SME data.
Sectoral differences follow a consistent logic. Retail trade, restaurants and hotels accept cash at 93%; the arts, entertainment and recreation sector at 84% — lower, but improving since 2024. Within retail, acceptance ranges from 91% in day-to-day shops to 96% at petrol stations. In seven euro area countries, every restaurant in the sample accepts cash; in the Netherlands, only 78% do — the lowest restaurant acceptance rate in the euro area.
Perhaps the most forward-looking indicator is intention: 92% of companies that accept cash today say they will continue to do so over the next five years. In most countries this share is overwhelming. The exceptions are concentrated and specific: in Cyprus, 51% of SMEs say they may not accept cash in the future, in Greece 23%, and in Bulgaria — surveyed for the first time following its euro adoption in January 2026 — 18%.
2. The infrastructure signal: why the non-acceptors matter
The companies that do not accept cash are a small minority — 8% of the euro area total — but the reasons they give repay close attention, because they identify the mechanisms through which acceptance could erode in the future.
The most frequent reason remains insufficient customer demand (36%, roughly stable versus 39% in 2024). The second reason is the one that moved: the share of non-accepting companies citing the inconvenience or difficulty of depositing and withdrawing cash rose from 22% to 35% in two years. Security concerns also rose, from 25% to 29%.
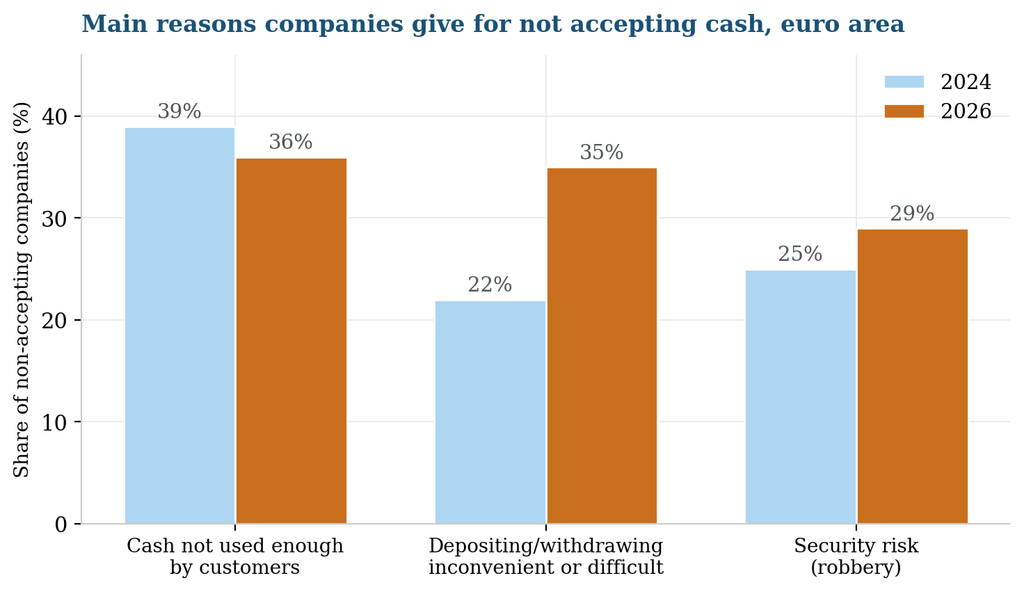
Chart 3. Source: ECB, Use of cash by companies in the euro area, 2024 and 2026. Companies could select up to three reasons.
This distinction matters analytically. A company that stops accepting cash because customers no longer use it is responding to demand. A company that stops because it cannot conveniently deposit its takings is responding to the state of the cash cycle infrastructure — the network of bank branches, counters, cash-in machines and cash-in-transit services that make cash commercially workable for a merchant. The first mechanism is consumer-driven and gradual; the second is supply-driven and can be self-reinforcing, since every branch closure raises the cost of cash handling for every remaining cash-accepting business in its catchment area.
The survey’s data on company deposit behaviour sharpen the point. Bank counters have become the primary method for depositing cash (58% of depositing companies), overtaking cash-in machines (55%) — a reversal of the pattern observed in 2021 and 2024. The use of cash-in-transit services for deposits fell by nine percentage points. Companies are relying more heavily on precisely the channel — the physical bank counter — that European banking consolidation has been steadily thinning for fifteen years. EU-27 bank branch numbers fell from roughly 238,000 in 2008 to under 130,000 in 2023.
The ECB’s own conclusion is measured but unambiguous: responsible authorities “need to be proactive in their policies and actions” to ensure banknotes and coins remain an attractive and accepted means of payment across all countries and sectors. The survey thus lands squarely in the middle of the legislative process on the legal tender regulation, whose access and acceptance provisions — currently in trilogue — address exactly the infrastructure channel the data identify.
3. What euro area merchants actually think of cash
Beyond acceptance rates, the 2026 survey asked companies to compare cash with digital payments across six dimensions: overall costs, transaction speed, ease of handling, reliability, security and privacy. The question was put to all companies that accept both cash and at least one digital instrument — that is, to businesses with daily operational experience of both.
The result is one of the survey’s most striking findings: there is no dimension in which companies, in net terms, judge digital payments to be clearly better than cash. Companies consider cash significantly better than digital payments in terms of privacy and reliability, and a high share also rate cash better on overall costs, transaction speed, ease of handling and security. This is a merchant-side verdict, not a consumer sentiment — and it comes from the very businesses that have spent the past decade installing terminals and adopting mobile acceptance.
This is a judgement about the merits of cash as an instrument, not a report on how easy cash has become to handle. The two are frequently conflated, and the distinction matters for how this finding should be read. A merchant can rate cash as more reliable and more private than card payments while simultaneously facing a longer round trip to the nearest bank branch to deposit it than five years ago. The survey’s own data on deposit and withdrawal behaviour, discussed above, show exactly that: rising reliance on bank counters at the same time as the branch network that hosts them keeps shrinking. Higher regard for cash coexists with a harder operating environment for using it — which is the case for continued attention to access and acceptance conditions, not evidence that it is no longer needed.
The picture is not uncritical. When asked about their biggest concerns in handling cash, companies point first to the risk of mistakes when giving change (32%), then to safety understood as robbery risk (29%) and to internal fraud (20%). Notably, the costs of depositing and withdrawing cash, and the availability of such services, rank low among stated concerns — even as they rise sharply among the reasons given by the minority that has stopped accepting cash. The businesses still inside the cash system worry about operational risks; the businesses that have left cite infrastructure. That asymmetry is itself informative about where the pressure operates.
On preferences, the survey finds a market with no dominant view: one in three euro area companies has no preference as to how customers pay at physical locations, 24% prefer debit cards, 21% prefer cash and 14% credit cards. Larger companies (250+ employees) show a lower preference for cash than SMEs. And when companies choose which payment methods to accept, the criterion they cite most often is consumer preference (26%), ahead of security (22%) and ease of handling (15%). The acceptance landscape, in other words, is still primarily demand-following — which is precisely why the infrastructure channel identified in the previous section, operating independently of demand, deserves particular attention.
The survey also documents how companies interact with the cash cycle. A majority of companies (59%) deposit cash, while far fewer (22%) withdraw it — mostly to keep change available (82% of withdrawing companies). Bank counters have become the leading channel on both sides: 60% of withdrawing companies use the counter (up nine points since 2024) and 58% of depositing companies do. The use of cash-in-transit services has contracted markedly — from 21% to 7% of withdrawing companies, and down nine points for deposits. European merchants are consolidating their cash logistics onto the banking network at exactly the moment that network is itself consolidating.
4. The United States in 2026: a stable floor
The Federal Reserve’s Diary of Consumer Payment Choice, published in May 2026, approaches the same subject from the opposite side of the counter. Where the ECB surveys merchants, the Fed surveys consumers: each October since 2016, a national panel records every payment made over a three-day period, along with cash holdings and stated preferences.
The headline finding of the 2026 wave is continuity. US consumers made an average of 47 payments per month, of which 16 were by credit card, 15 by debit card and six in cash. Cash was the third most used payment instrument for the sixth consecutive year. Payment behaviour, in the Fed’s own summary, “remained largely consistent over the past three years, even amid technological changes and other activity in the payments ecosystem”.
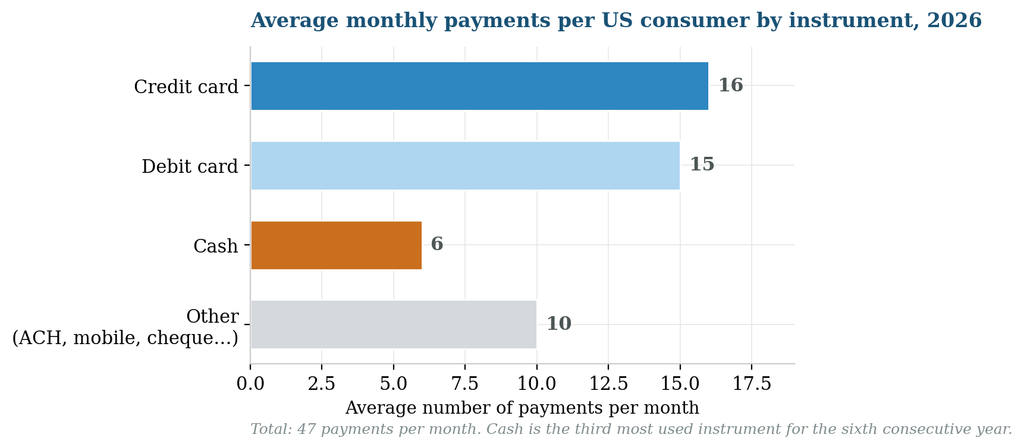
Chart 4. Source: Federal Reserve Financial Services, 2026 Diary of Consumer Payment Choice.
Six payments out of 47 is roughly 13% of transaction volume — a substantially lower cash share than the euro area, where the ECB’s SPACE 2024 consumer survey recorded cash at around half of point-of-sale transactions by volume. The United States is, by this measure, considerably further along the digital transition than Europe. What is striking is not the level but the flatness: the American cash share has stopped falling. It has found a floor.
Preferences tell a similar story of slow, structural change followed by stabilisation. The share of US consumers who prefer credit cards for in-person payments rose from 24% in 2016 to 38% in 2026, nearly drawing level with debit at 40%. But these shifts have decelerated markedly in recent waves — the Fed notes that in-person payment preferences “have stabilized” in recent years.
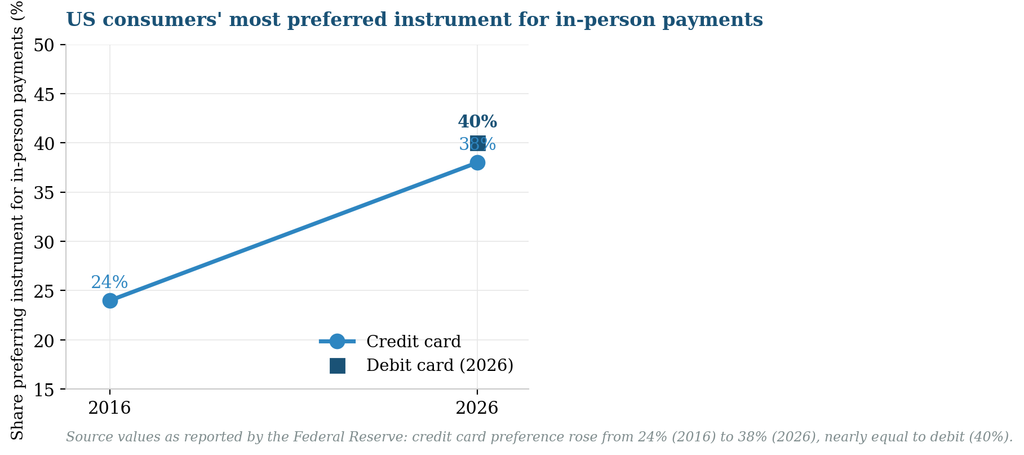
Chart 5. Source: Federal Reserve Financial Services, 2026 Diary of Consumer Payment Choice.
5. Cash’s second life: the store-of-value dimension
Where the American data become genuinely distinctive is in what they reveal about cash held rather than cash spent. In 2025, 76% of US adults carried cash in their pocket, purse or wallet, holding an average of $69. Beyond that, 45% of consumers kept cash stored elsewhere — at home, typically — for savings or emergency purposes, in an average amount of $364.
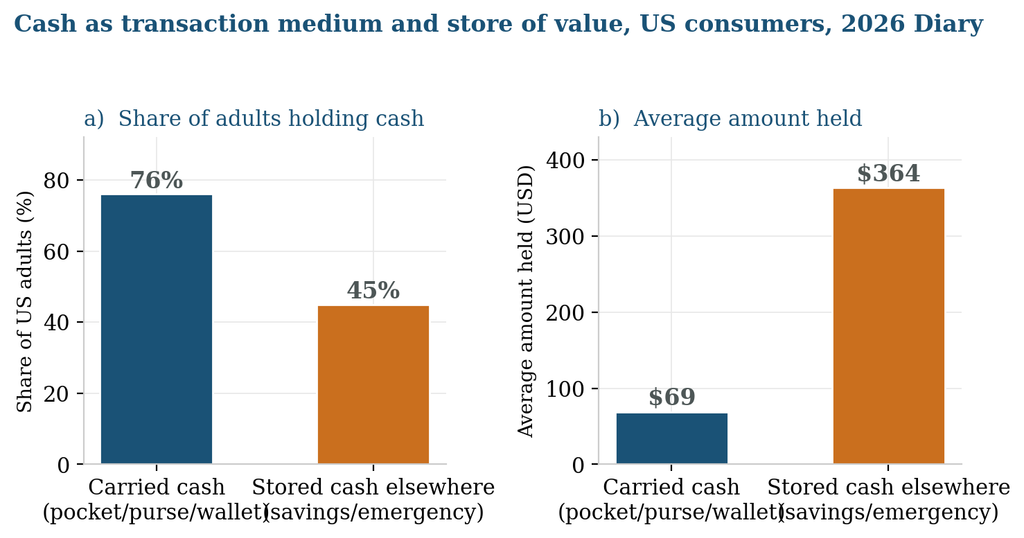
Chart 6. Source: Federal Reserve Financial Services, 2026 Diary of Consumer Payment Choice.
The Fed describes cash as “a key backup payment option and store of value for many Americans”. This backup function is analytically distinct from transactional use, and it is measured directly: four out of five US consumers used cash at some point in the past 30 days — far more than the six-payments-per-month average would suggest if cash use were concentrated among a minority — and 90% state that they plan to continue using cash in the future.
In other words, the low American transactional share coexists with near-universal cash participation. Most Americans use cash sparingly, but almost all of them use it, hold it, and intend to keep doing so. Cash in the United States has become something like an insurance policy: rarely claimed, widely held, and highly valued precisely for the contingencies in which nothing else works.
The demographic pattern reinforces this reading. Households earning under $25,000 a year and adults aged 55 and over rely on cash more than other groups. Rural residents make an average of nine cash payments per month against six for suburban and urban consumers — a 50% differential that maps directly onto the geography of banking infrastructure and connectivity.
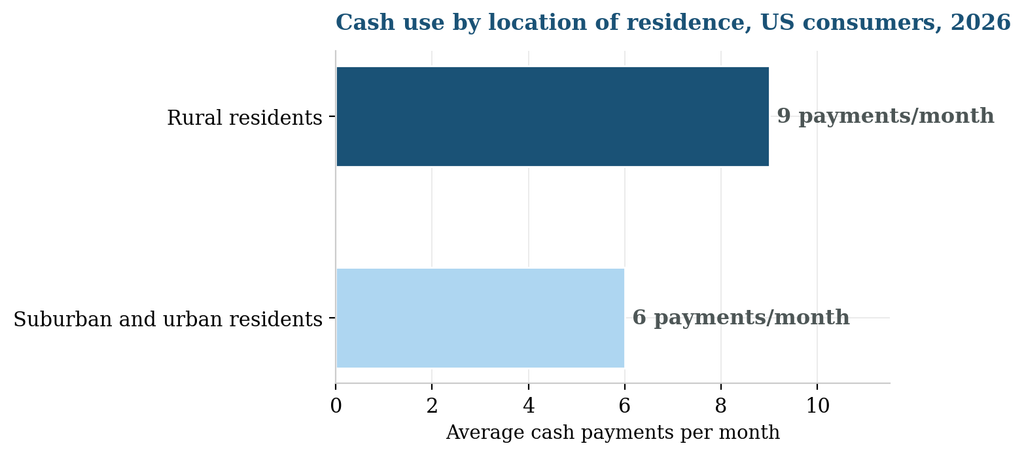
Chart 7. Source: Federal Reserve Financial Services, 2026 Diary of Consumer Payment Choice.
These are, notably, the same groups that European data consistently identify as most cash-reliant: older citizens, lower-income households, rural populations. The social profile of cash dependence is transatlantic, even where the aggregate levels differ.
6. What can and cannot be compared
Before drawing conclusions from the juxtaposition, three methodological cautions are in order.
First, the two surveys measure different sides of the market. The ECB study surveys companies about acceptance; the Fed Diary surveys consumers about use. Acceptance and use are related but distinct: acceptance can remain high while use falls (the current euro area configuration), and use can be stable at a low level with no legal acceptance obligation at all (the American configuration). Neither survey alone captures the full equilibrium.
Second, the units differ. The ECB reports shares of companies; the Fed reports payments per consumer per month. The euro area consumer-side comparison requires SPACE (last wave 2024, next expected 2026); the US merchant-side comparison has no direct federal equivalent.
Third, the timing differs slightly. The Fed’s fieldwork was conducted in October 2025 and published in May 2026; the ECB’s fieldwork ran from February to April 2026 and was published in August 2026. Both are current, but neither is simultaneous with the other.
With those caveats, the comparable core is meaningful — particularly on the forward-looking indicators, where the two surveys ask nearly symmetrical questions of their respective populations.
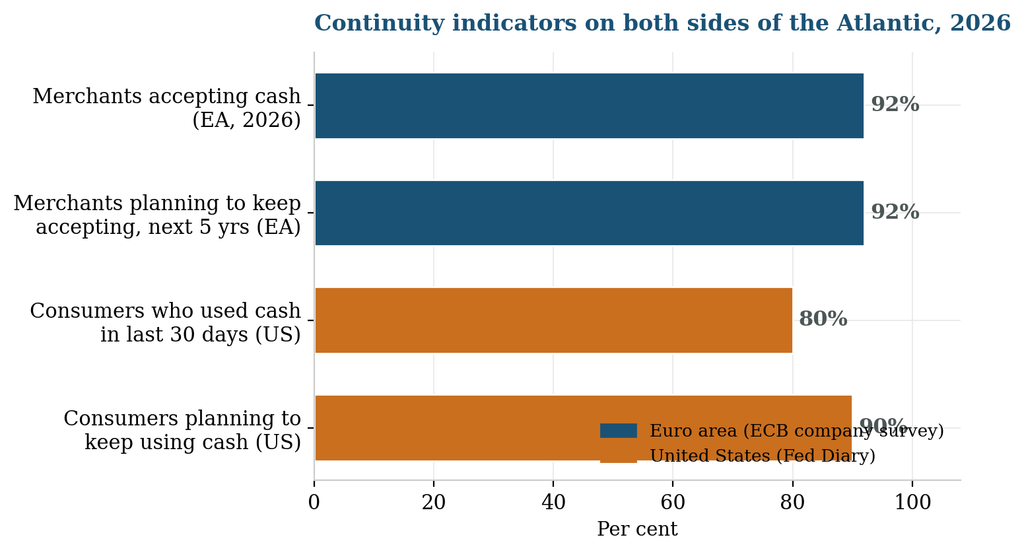
Chart 8. Sources: ECB, Use of cash by companies in the euro area, 2026; Federal Reserve, 2026 Diary of Consumer Payment Choice.
On both sides of the Atlantic, the continuity indicators are high and remarkably aligned: 92% of euro area merchants plan to keep accepting cash; 90% of American consumers plan to keep using it. Whatever the differences in level, trajectory and institutional framework, neither system is preparing for a cashless future.
7. Two equilibria, two protection models
A view sometimes heard in the European cash community is that the United States protects cash more effectively than Europe, and that Europe is making itself vulnerable by pushing harder towards digital payments. The 2026 data allow that proposition to be examined with more precision than usual — and the result is more interesting than either a confirmation or a rebuttal.
Where the American system is stronger
The United States exhibits something the euro area has not yet demonstrated: a multi-year stable floor for transactional cash use. Three consecutive years of flat cash payments per capita, in the world’s most developed digital payments market, is evidence that cash demand does not converge to zero — it converges to a resilient core built on backup use, store-of-value holdings, and the preferences of specific population groups. For European observers who fear an endless downward spiral, the American data are, paradoxically, reassuring: they suggest the spiral has a bottom.
The American equilibrium also rests on an enormous store-of-value base. The scale of household cash hoarding — nearly half of adults holding an average of $364 outside their wallets — anchors demand for physical currency independently of its transactional share, and sustains the circulation infrastructure that transactional use alone might not.
Where the European system is stronger
Europe enters the comparison with a transactional cash share several times higher than the American one, near-universal merchant acceptance, and — crucially — the only comprehensive legislative protection framework for cash under construction anywhere in the advanced world. The legal tender regulation now in trilogue would create binding acceptance obligations, access standards, national enforcement authorities and annual monitoring across 20 countries. Nothing remotely comparable exists at the US federal level, where cash acceptance mandates remain a patchwork of state and municipal ordinances.
It is worth being precise about what the American stability does and does not reflect. It is a market equilibrium — the product of consumer behaviour, merchant economics and an infrastructure that remains commercially viable. It is not the product of legal protection. Should American merchant acceptance begin to erode the way parts of northern Europe have experienced, the US federal framework currently offers few instruments to respond. Europe is legislating precisely the instruments whose absence the American system has not yet had to confront.
A further distinction is worth drawing out on the European side. Both datasets register something that could be mistaken for good news requiring no further action: consumers and merchants appear to value cash more clearly than in earlier waves — as a privacy safeguard, a reliability hedge, a backup against disruption. That growing appreciation is real, but it is a statement about demand and sentiment, not about the conditions under which cash can actually be obtained, deposited or withdrawn. The survey evidence on access and infrastructure moves in the opposite direction from the survey evidence on attitudes: companies are coming to rely more heavily on a banking network that keeps contracting, and the fastest-growing reason for abandoning cash is not that customers want it less but that handling it has become harder. Rising appreciation without improving access does not resolve the vulnerability question — it sharpens it, since it means the demand that acceptance and infrastructure policy is meant to serve is, if anything, strengthening.
Where the concern has empirical substance
The vulnerability argument is strongest not as a general proposition but as a specific one about infrastructure. The euro area survey’s most significant negative finding — the rise from 22% to 35% in companies citing deposit and withdrawal difficulty as a reason for refusing cash — identifies a mechanism that operates regardless of consumer demand. If the cash cycle becomes commercially unworkable for merchants, acceptance falls even where customers still want to pay in cash and the law says they may.
This is also where the transatlantic difference in trajectory is sharpest. The American equilibrium was reached after a long adjustment; the European one is still forming, and it is forming during the steepest phase of branch network consolidation. The euro area’s task, on the evidence of these two surveys, is not to prevent an American-style outcome — the American outcome, on 2026 data, is a stable and functioning cash system — but to manage the transition to its own equilibrium without allowing infrastructure erosion to run ahead of consumer demand. The data suggest that acceptance obligations alone do not settle this: what merchants need is not only a duty to accept cash but a workable way to bank it.
8. The automation frontier
One finding in the ECB survey deserves separate attention because it identifies a form of acceptance erosion that no headline acceptance rate captures. In the euro area, 13% of companies have introduced self-checkout terminals. Among those companies, 52% accept cash in at least some of the terminals — which means 48% accept cash in none of them.
A supermarket that formally accepts cash at one staffed till while operating eight card-only self-checkout lanes is counted as cash-accepting in every survey. But the practical experience of paying in cash there has changed: longer queues, fewer service points, an implicit signal about which payment method the establishment prefers. The ECB names the risk directly, noting that “even though most companies accept cash…, among consumers the perceived acceptance of cash may go down because companies have reduced the ease of paying with cash”, and concluding that it is crucial to ensure “that the increasing automation of payments does not inadvertently hinder or undermine cash as a viable payment option”.
Related survey evidence points in the same direction: 25% of euro area companies report having implemented measures in the past year to encourage digital payments or reduce cash payments — most commonly acquiring cashless tills or reducing cash-accepting ones (37% of those companies), and promoting cashless payment (30%). None of this is captured by the binary acceptance statistic, and all of it shapes the consumer’s real freedom of payment choice.
For monitoring frameworks — including the common indicators that the European Commission will define under the legal tender regulation — this suggests that measuring formal acceptance will not be sufficient. The relevant quantity is effective acceptance: whether paying in cash remains practically convenient, not merely legally possible. The Dutch central bank’s granular sector-level surveys, and the distinction they draw between refusal, ambiguous signage and genuine acceptance, offer one model of what such measurement can look like.
9. Concluding observations
Read side by side, the two 2026 publications describe not one story of decline but two different equilibria. The United States shows what a mature, low-share, high-stability cash system looks like: cash as universal backup and store of value, used sparingly but held broadly, resting on market forces rather than legal obligation. The euro area shows a higher-use system in mid-transition, with stabilising merchant acceptance, sharply divergent national trajectories, and a legislative framework being built in real time to underwrite the outcome.
The comparison does not support the simple proposition that one side of the Atlantic protects cash and the other abandons it. It supports a more precise observation: the two systems protect cash through different mechanisms — behavioural in America, increasingly institutional in Europe — and each mechanism has a weakness the other does not. America’s market equilibrium has no legal safety net beneath it. Europe’s legal safety net is being stretched over an infrastructure that is thinning faster than anywhere else.
The most valuable finding for European policy, finally, may be the least dramatic one: the American floor exists. Cash demand in a highly digitalised economy stabilises rather than vanishing, sustained by backup use, precautionary holdings and the needs of specific groups. The policy question for Europe is not whether such a floor exists — the American data suggest it does — but whether Europe’s cash infrastructure will still be standing on it when the transition settles.
Neither survey offers grounds to conclude that the work of protecting cash is now complete. If anything, the opposite: rising appreciation for cash among the people and businesses who use it, set against a banking infrastructure that continues to thin, is precisely the configuration in which legal safeguards on acceptance and access matter most. Demand for cash and the ease of acting on that demand are not the same variable, and the 2026 data show them moving apart rather than together.
Sources
- European Central Bank, ‘Use of cash by companies in the euro area in 2026’, 13 August 2026. Survey of 8,205 companies in 21 euro area countries, fieldwork 23 February – 10 April 2026 (Ipsos European Public Affairs). https://www.ecb.europa.eu/press/use-of-cash/html/ecb.uccea202608.en.html
- Federal Reserve Financial Services, ‘2026 Findings from the Diary of Consumer Payment Choice’, May 2026. Annual national survey conducted each October; participants record all payments over a three-day period. https://www.frbservices.org/news/research/2026-findings-diary-consumer-payment-choice
- European Central Bank, ‘Study on the Payment Attitudes of Consumers in the Euro Area (SPACE) 2024’. Reference for euro area consumer-side cash share at point of sale.
- European Central Bank, ‘Payments statistics: second half of 2024’, 23 July 2025. EA-20 payment infrastructure aggregates.
- European Banking Federation, ‘Banking in Europe: Facts & Figures 2024’, December 2024. EU-27 bank branch series 2008–2023 (ECB/NCB data).
- European Parliament Legislative Train, ‘Scope and effects of legal tender of euro banknotes and coins’ (2023/0208(COD)); Council of the EU press release of 19 December 2025; ECON committee vote of 23 June 2026. Status of the legal tender regulation.
- De Nederlandsche Bank, annual cash acceptance surveys (Locatus), 2022–2024. Referenced as a model of granular acceptance measurement.
All figures cited in this note are taken directly from the two primary publications or from the additional sources listed above. Chart underlying data are as published by the ECB and the Federal Reserve; where a source provides a value only for one period, charts display only the reported values.